TACTIC 7: VIDEO
MAKE IT SIMPLE
how to use complex data
download this tactic card (pdf 792kb)
watch the full video
THIS TACTIC IS GOOD TO USE WHEN YOU NEED TO PRESENT AND SHARE COMPLEX OR HARD-TO-ACCESS INFORMATION WITH THE PEOPLE WHO NEED IT MOST
EXAMPLES FROM THE VIDEO
|
|
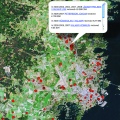
By FarmSubsidy.org and advocates in Sweden After FarmSubsidy.org began compiling information on farm subsidy funds from Swedish government sources, it had so much data it was difficult to make sense of it. To understand this data and present it in a powerful way, it plotted farm subsidy payments on a Google Map so that people could zoom in to see what money went where to carry out their own investigations and draw their own conclusions.
TOOLS USED: Freedom of Information Act (FOIA) requests, Xapian database (open source software), Google Maps, website.
LINKS TO LEARN MORE: |
|
|
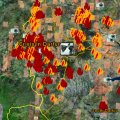
By advocates/technologists working with the US Holocaust Memorial Museum A team of advocates and technologists collaborated on a complex 3D map to display the damage to over 2000 villages; show the location of 2.5 million internally displaced persons and refugees; and provide open access to numerous photos, videos, and testimonies from Darfur.
TOOLS USED:Google Earth, data from the United Nations and Amnesty International, photos and videos, website.
LINKS TO LEARN MORE:: |
TACTIC 7: PLAN YOUR ACTION
MAKE IT SIMPLE
how to use complex data
download this tactic card (pdf 792kb)
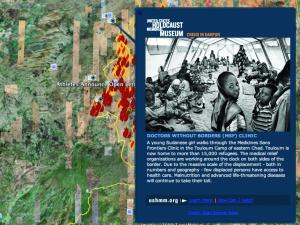
CRISIS IN DARFUR/GOOGLE EARTH
Plan your action
- Research the relevant Freedom of Information access guidelines in your campaign's region. There may be people with whom you can collaborate outside your country who can get you the data you need by requesting information from their own governments.
- Develop criteria and clear processes for verifying the data that you will use in your campaign. Who can help you make sense of the data?
- If your data uses specialised jargon that's difficult for most people to understand, who can help you translate this into plain language?
- Sometimes data is accessible to the public, but it may be hard for the public to draw conclusions because it is published in static documents that cannot be searched or cross-referenced. How will your campaign make this data more useful?
- Some tools, like Google Maps and Google Earth, can require a lot of computing power and internet bandwidth. Think about the people you want to take action in your campaign: what tools will be easiest for them to access and use?
Do it yourselfAsk
- What specific data do you need access to and how can you get it?
- How will you use the media to draw attention to your information requests or to your findings?
- How can you involve your group in gathering, verifying and publicising data?
- If you do not have a Freedom of Information Act in your region, what other forms of public pressure can you use to access data?
- Is there a visual way to present your data - on a 2D or 3D map, using animation, a video, or poster?
- What action will you ask people to support or implement based on your findings?
- Will you be able to open the data you gather to other advocates who might want to build upon your findings? How will this effect how you store and index the data?
Different ways you can do this
- If a government makes data available on an issue but it is spread across multiple websites, you can aggregate it on your website with your own tools for searching and commenting on it.
- For campaigns where total anonymity is not necessary, you can crowd-source the gathering of images, stories, and videos for your campaign by using a wiki – a website you can give anyone permission to edit. On the wiki, people can post items that need verification, and you can work with others to investigate and share findings. You should always carefully consider how you will verify information and ensure people are not portrayed wrongly.
- If you aren’t skilled at graphic design, you can pose your campaign as an invitation to others to create a visualisation or map from your data to best reach your target audience.
- You can use maps to make a network map, that illustrates the power relationships and transactions between corporations, individuals, donors, and others.
- Think about whether your campaign or project is dynamic or static. Making it dynamic will take more time, but it may be vital if you are trying to report on rights abuses. Either way, be open and clear on what you are trying to achieve and how quickly you will respond.
|
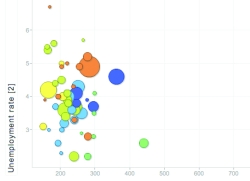
FEATURED TOOL Visualise data over time Google Motion Chart can use your data to make an animated graph showing how different sets of information relate to one another over time. Motion Chart can display data from any Google Spreadsheet that you link to the chart. The chart can then be shared on your website as a Flash animation. As Google Motion Chart relies on data saved in Google Spreadsheet, this means that you must be connected to the internet to update data, and that your data will be stored on servers maintained by Google. For very sensitive data, this may not be an ideal tool. This video guides you through how to install and use the chart. |
TIPS ZUZANA WIENK FROM FAIR PLAY ALLIANCE, ON LOCALISATION: "Be sensitive to what tools are best in your country or region. In Poland, we couldn’t create an online database as we had done in Slovakia because they didn’t have access to this kind of data – for example, we could not create a database to show both donations to political parties and public procurement. Also, FOIA laws will be different in each region."
JACK FROM FARMSUBSIDY.ORG, ON GETTING ACCESS: "It's really important to know exactly what you’re asking for. You’ve got to know that government holds this data, and that requires a bit of research on what the government holds – you may also develop relationships with friendly civil servants who can tell you, or you can look at the laws to find out what they are required to hold."
ZUZANA WIENK FROM FAIR PLAY ALLIANCE, ON CROWD-SOURCING: "My feeling is society is really changing towards more informal collaboration and ad-hoc activism. People are skilled and open to interact and contribute, but we have to create spaces for that, and that space has to be attractive and give people some kind of public recognition or their work. A web space is great for that." |
TACTIC 7: CASE STUDY
MAKE IT SIMPLE
how to use complex data
download this tactic card (pdf 792kb)

Case Study
| TITLE: WHO: WHERE: WEBSITE: |
Fair Play Fair Play Alliance Bratislava, Slovakia Fair Play Alliance |
DESCRIPTION
Using Freedom of Information (FOI) requests, Fair Play gathers invoices and other documents that show how the Slovakian government spends its money, adds this material to a database connected to its website, and invites people to use this information to influence political change. Zuzana Wienk from Fair Play says, "We started to experiment with this during a huge scandal we had in Slovakia recently concerning European Union (EU) funding. The media learnt that contracts were given to companies that are closely connected to the government’s leaders. Using FOI laws we started to request more and more data about contracts between these companies and Ministers, also requesting invoices and other accounting data. We produced graphs from this information and put them online, and we also scanned all the invoices and made them available." Soon after doing this, NGOs, journalists, concerned citizens and academics started to analyse the data themselves and write about it. "There were very active forums based on these articles", says Zuzana. "This made us feel it was important to include the public in these investigations – that people have the interest, skills and expertise". By making the information easy to access, a debate was created around public spending and pressure for change became so great that one Slovak construction minister had to resign.
| TOOLS USED: | Custom-built database, using open source tools (mySQL, Apache server, and PHP). Data imported from Freedom of Information (FOIA) requests, in Excel spreadsheets, but sometimes they needed to be scanned or retyped. Web-scrapers are used to bring in data from online sources. |
| REACH: | The project tracks public spending in the Slovakian government. It is now expanding to track assets of Slovak members of European Parliament. During the EU funding scandal, the Fair Play website was one of the top three most visited in Slovakia. |
| RESOURCES: | Student volunteers assist in updating the database. Volunteer developers and programmers attended a BarCamp organised by Fair Play to plan the project. |
| TIME: | Nine months to get the first database up in 2003. Updated continuously, every three to 12 months, with data from new FOIA requests. |
LEVEL Of DIFFICULTY: 4.5
COST:USD$4000 in 2003 for the first programming and technical phase. One coordinator was employed in 2004 to update the database, costing USD$12,000.
LINKS TO LEARN MORE:
Fair Play database (slovak language)