TACTIC 3: VIDEO
PICTURE IT
visualise your message
download this tactic card (pdf 836kb)
watch the full video
THIS TACTIC IS GOOD FOR COMMUNICATING CREATIVELY ACROSS DIFFERENT LANGUAGES AND LITERACIES, AND FOR CAPTURING PEOPLE’S ATTENTION
EXAMPLES FROM THE VIDEO
|
|
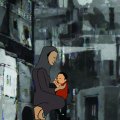
Women and Memory Forum, Cairo, Egypt
TOOLS USED: Adobe software (Photoshop, After Effects and Premiere) to animate hand-drawn sketches scanned into the computer.
LINKS TO LEARN MORE: |
|
|
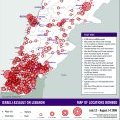
Samidoun, Lebanon
TOOLS USED: Adobe Illustrator, Blogspot, Wordpress.
LINKS TO LEARN MORE: |
|
|
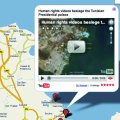
Tunisian advocates with Nawaat.org
TOOLS USED: Google Earth, Google Maps, YouTube.
LINKS TO LEARN MORE: |
TACTIC 3: PLAN YOUR ACTION
PICTURE IT
visualise your message
download this tactic card (pdf 836kb)
WOMEN AND MEMORY FORUM
Plan your action
- The animated folktales from Cairo (above) used symbols or characters, as a way to take a volatile issue and turn it into something easier for a reluctant audience to approach.
- The visuals and materials you create can be quite practical. For example, the maps from Lebanon had multiple uses: as a historical record, for crisis reporting, and to plan relief and aid work.
- Interactive visuals can use photos, illustrations, videos, and other submissions contributed by many different people. With the Tunisian Google Earth and YouTube mashup, new videos were added automatically as people posted them online and geo-tagged them.
- To reach people without fast internet connections, complex visualisations can also be shared offline: as videos for download or on VCD/DVDs, as large-scale posters, printed flyers or public space projections, or on USB memory sticks.
- Effective visualisations should not just make something visually appealing or entertaining. What’s more important is that they shape understanding and clarify meaning.
Do it yourselfAsk
- What’s most important for your visual campaign: to communicate across languages, to present dense information in simple graphics, and/or to surprise and engage people with creative, appealing visuals?
- Is your campaign focusing on a single concept or slogan? How might you design it so that it is understood quickly by the people you most need to reach?
- How can you involve people in adding to your campaign – by contributing photos and videos, by collaborating over distance or in person, or by sharing your videos, maps, or animations with others?
- What action will you ask people to support or take based on your campaign? Is sharing your media the action? Who are you asking them to share your media with – key people in government, local or community organisations, the media?
- How will you publicise your campaign’s visual media for those who do not have internet or computer access?
Different ways you can do this
- Make your own version of a tourist or city map that not only includes key landmarks but also information about your own specific campaign issue. Hand it out to visitors to the city, students or others who can be mobilised to take action.
- If you don’t know how to make an animated video, you can make a video from a series of still photos, adding music, subtitles and voice-over to unite the images around one story.
- Design graphic stickers that can be used to re-label products with information that corporations don’t readily make available: for example, criminal investigations into the company, or ways the manufacturer supports armed conflict.
- Give people cheap video cameras to record personal stories and use the videos to build an interactive map showing how different people in different regions are impacted by the same issue.
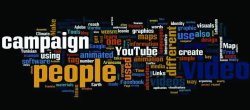
- You don’t have to be an expert with graphics to create visualisations. A tag cloud – a cluster of words that represents a larger body of text – can be a simple way to visually explain your issue by highlighting key words from an important document or website.
|
FEATURED TOOL Create a dynamic tag cloud |
TIPS PHIL ARONEANU, 350.ORG, ON KEEPING IT SIMPLE: "Using iconic images is really good. Look at the video 'It's my future'. It was made by students in a few days using one camera, simple editing software, and one iconic slogan – ‘It’s my future’ – that appears in different contexts and languages. It becomes iconic, and it’s educational for people even if they don’t know everything about the campaign."
TESSA LEWIN, PATHWAYS OF WOMEN’S EMPOWERMENT: "For animation and editing videos, there are some low-cost solutions, but not so many free ones. Although a lot of the work I do personally is about drawing frames and scanning them in and then playing around with them in Adobe software, all of that could also be done with free and open source software Gimp or Kino."
PHIL ARONEANU, 350.ORG, ON BRANDING AND IDENTITY: "We thought it was important to have a steady graphic identity in our campaign. We decided to use professional designers, but could only afford to have them do the one campaign video for us. But, we got them to send us the files for all of the graphics used in the video so I can use them for lots of different stuff: logos, blog posts, print materials. For us, it ended up being a way to save money." |
TACTIC 3: CASE STUDY
PICTURE IT
visualise your message
download this tactic card (pdf 836kb)

Case Study
| TITLE: WHO: WHERE: WEBSITE: |
350: International Day of Climate Action 350.org Actions in nearly 100 countries 350.org |
DESCRIPTION
To inspire people to organise climate change actions around the world, 350.org created an animated video about climate change. The animation uses strong visuals and does not use any words, meaning that no one language is required to understand it. The primary concept is the number 350, which refers to "the number scientists say is the safe limit of carbon dioxide in the atmosphere," says Phil Aroneanu of 350.org. "We knew if we were going to do this campaign globally, we could use this number to get everybody talking about it." After 350.org made a mock-up of the video using Microsoft Paint software, Free Range Studios designed and produced the full animated version using Flash. The animation was published on 350.org, as well as on YouTube and Facebook. DVDs of the video were sent to groups and television stations in regions where internet access made downloading the video difficult. On the success of the animation, Phil says, "It’s hard to call it an organising tool, but it’s a way to hook people in, get them to the website so they can think about what they want to do. It also has that cool factor – people feel like they are in on something. On the downside though, it doesn’t actually help people understand 350 as much as I’d like, since it is so quick." Though the animation was expensive for 350 to produce, it established a strong graphic identity, and they are now able to use this imagery consistently in all of their materials.
| TOOLS USED: | YouTube and Facebook Page with 10,000 members. Orkut, MySpace, Twitter. Zandy, an "event-organising tool like Facebook Events, translated into many different languages." |
| REACH: | Video had 100,000 views over one year on YouTube. Campaign is global, with nearly 30 staff and interns and close to 100 live actions planned worldwide. |
| RESOURCES: | The outreach campaign was built from networks of campus-based activists in the US, and expanded internationally through climate change summits and conferences. "Collaboration is what lets us run on almost no budget," says Phil. "We’re not just using a network, but creating one." |
| TIME: | Three months to create the video. Campaign total time from end of 2008 to early 2010. |
LEVEL Of DIFFICULTY: 3 out of 5
COST: USD$10,000 for the video. Ongoing staff costs to manage and implement the project.
LINKS TO LEARN MORE:
350 animated video on Youtube
350 Youtube channel